Charting the Coronavirus in Scotland - 5th June 2020
All of the charts in this post are made from the Scottish Government's data, which can be found on their Coronavirus in Scotland page and by using the Wayback Machine to see this page on previous days.
I made these visualisations for myself but I thought that others might like to see them too, so I'm posting them here.
The Positive Cases for Each Health Board in Scotland
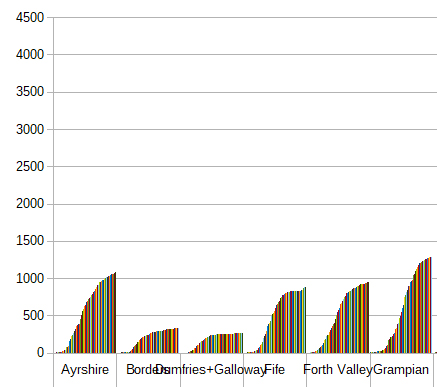
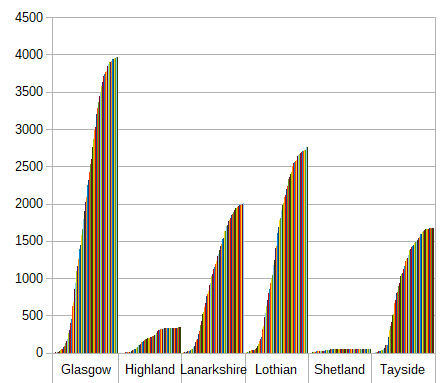
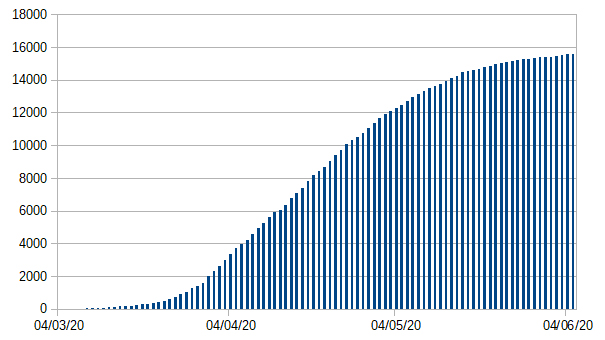
The first chart shows the rising positive cases of coronavirus over time in every health board area in Scotland. The second shows the rising positive cases of coronavirus for Scotland as a whole.
The Total Positive Cases for Scotland
The Weekly Average for Daily Positive Cases in Scotland
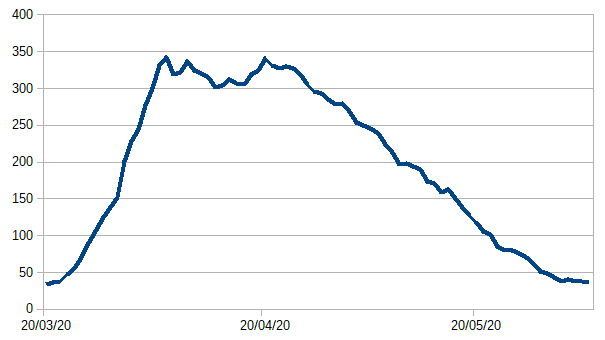
This chart shows the weekly average of positive cases (calculated each day) for Scotland.
The Number of Tests Performed Each Day
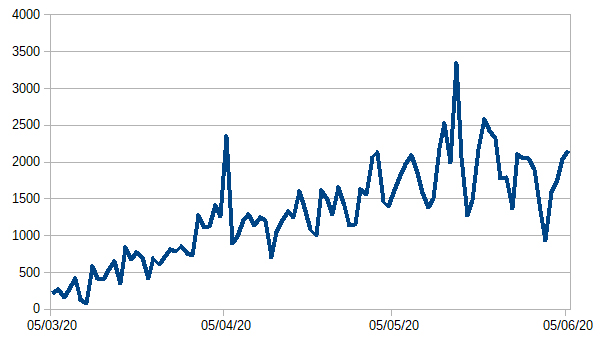
The Number of Tests Done Each Day chart shows the difference in the number of total tests published each day at 14:00 to get an approximate figure for tests done each day.
Number of tests done each day in Scotland shows the rising figure. In Germany and South Korea they test 20,000 a day (with populations of 80 and 50 million respectively - from the 20th March). The UK is testing 10,000 a day (with a population of around 65 million). See below for per capita testing results for total tests done in each country.
Coronavirus Test Success Rate, Tests Positive / Total Tests
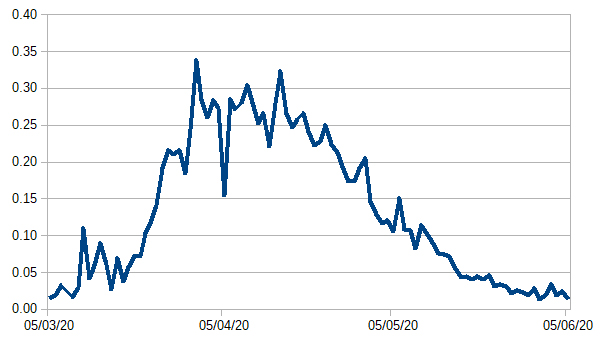
The Coronavirus Test Success Rate looks at the number of tests published as positive for a day divided by the number of tests given. Some say that the best way to fight the coronavirus is to test very widely, including those who don't yet have symptoms. If a success rate is very high it might suggests that only people with obvious symptoms are being tested. The German figure comes from Ourworldindata.org where they state that of March 15 "167,009 samples were tested in 148 laboratories by the end of last week, of which 6540 were positive." so the success rate is 6540 / 167009 = 0.039; this is similar to Scotland's rate of 0.04 as of the 20th March with 322 positive results over 7550 total tests. As of the 27th of March the Scottish rate is 0.09. France have had 36747 tests with 6153 positive, which is a success rate of 0.16 (also from the 15th March). In the Italian village of Vo, that has contained the outbreak, they initially tested everyone in the village (3,300 people) and found around 3% had the virus (a rate of 0.0269 with 89 people infected). After a quarantine of two weeks they retested everyone and only found 14 with the condition, a rate of 0.0042. A higher rate of success in testing can also indicate a rise in the number of people with symptoms that do have the virus in society at large.
The Number of Tests in Each Country per Capita
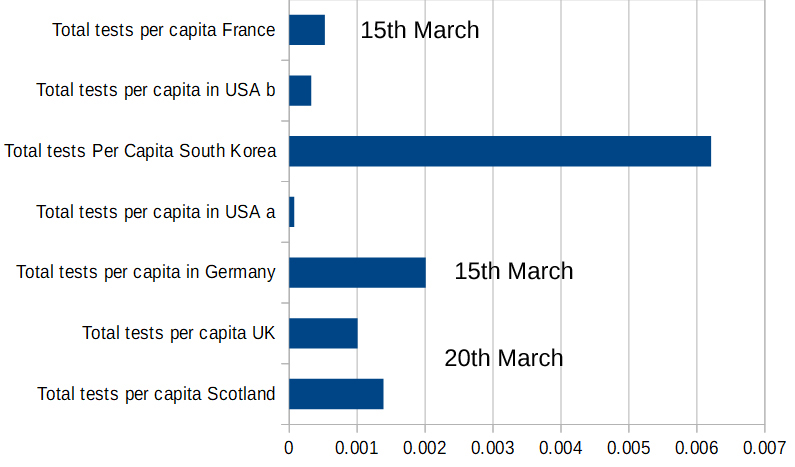
This chart shows the per capita number of tests done in each country. South Korea obviously started weeks before the European states but it's reported that they currently test 20,000 a week, like Germany. There are two results for the USA from mixed reports. Data from Germany and South Korea dates to the 15th of March; whereas, data on the UK and Scotland dates from the 20th.
The Total Number of Deaths in Scotland with Positive Test
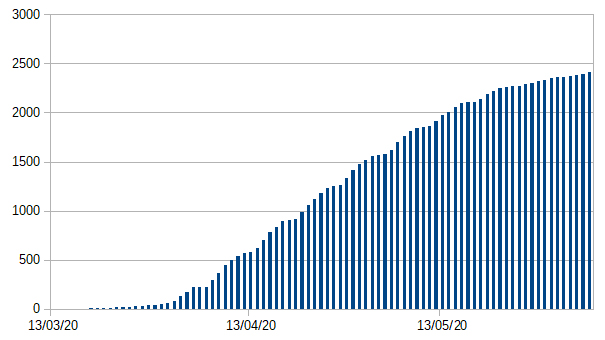
This is a record of the total number of deaths in Scotland where a patient has tested positive for coronavirus.
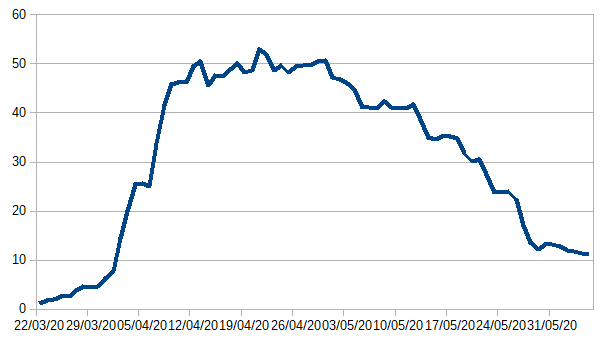
The Weekly Average of Daily Deaths of Patients with Coronavirus
Percent Weekly Change in Positive Cases
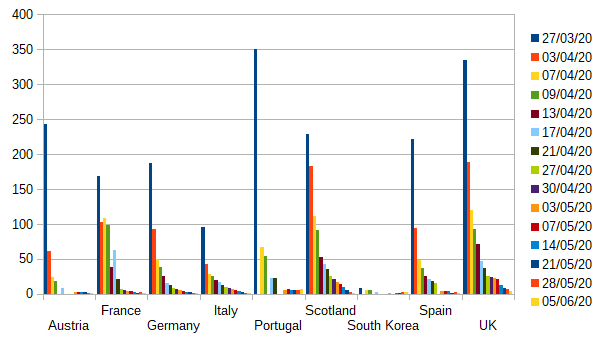
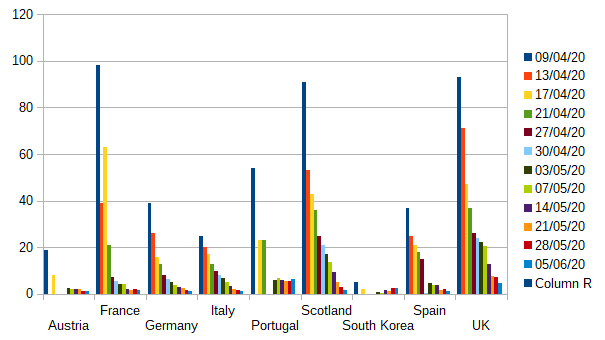
The percent weekly change is an important measure to know if the acceleration of the spread of the disease is reducing. We can see that in Scotland the lockdown does seem to be having a positive effect. We can see that on the 27th of March the number of positive cases was doubling every 3 days and two weeks week later and it was doubling every 7 or more days.
The Number of Patients in Hospital in Scotland
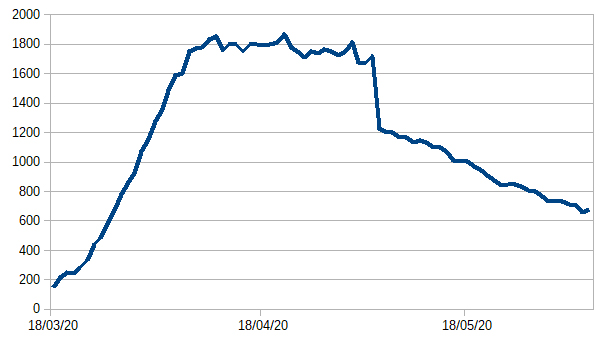
This chart shows the number of patients in hospital with suspected or confirmed coronavirus in Scotland.
The Number of Deaths in Scotland by Age Group
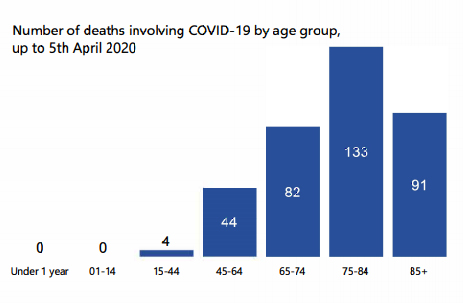
This chart is from the NRS report and it shows the deaths in Scotland due to coronavirus by age group. For the full report see the links section below.
The Number of Deaths in Scotland by Health Board
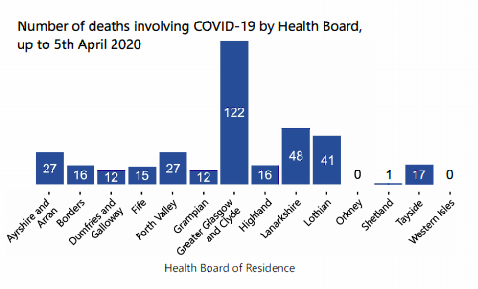
This chart is from the NRS report and it shows the deaths in Scotland due to coronavirus by health board area. For the full report see the links section below. The full report has a more detailed chart on this.
Links
- Coronavirus Scotland Daily Government Report
- NRS: weekly report
- NRS: Deaths involving coronavirus (COVID-19) in Scotland Week 14 (30 March to 5 April 2020)
- Coronavirus Charts in The Courier
- Covid-19 Update
- Covid-19 charts on facebook
- Imperial College Covid-19 model
- BBC: Coronavirus in Scotland: A daily breakdown on cases
- BBC: Coronavirus in Scotland: Who is dying and where?
- Wikipedia: Coronavirus in Scotland
- Scotland Coronavirus Tracker
- Covid 19 stats for /r/supplychain
This post is rushed and will be improved and updated over time.